Mastering Python for Data Analytics: From Pandas to Power BI
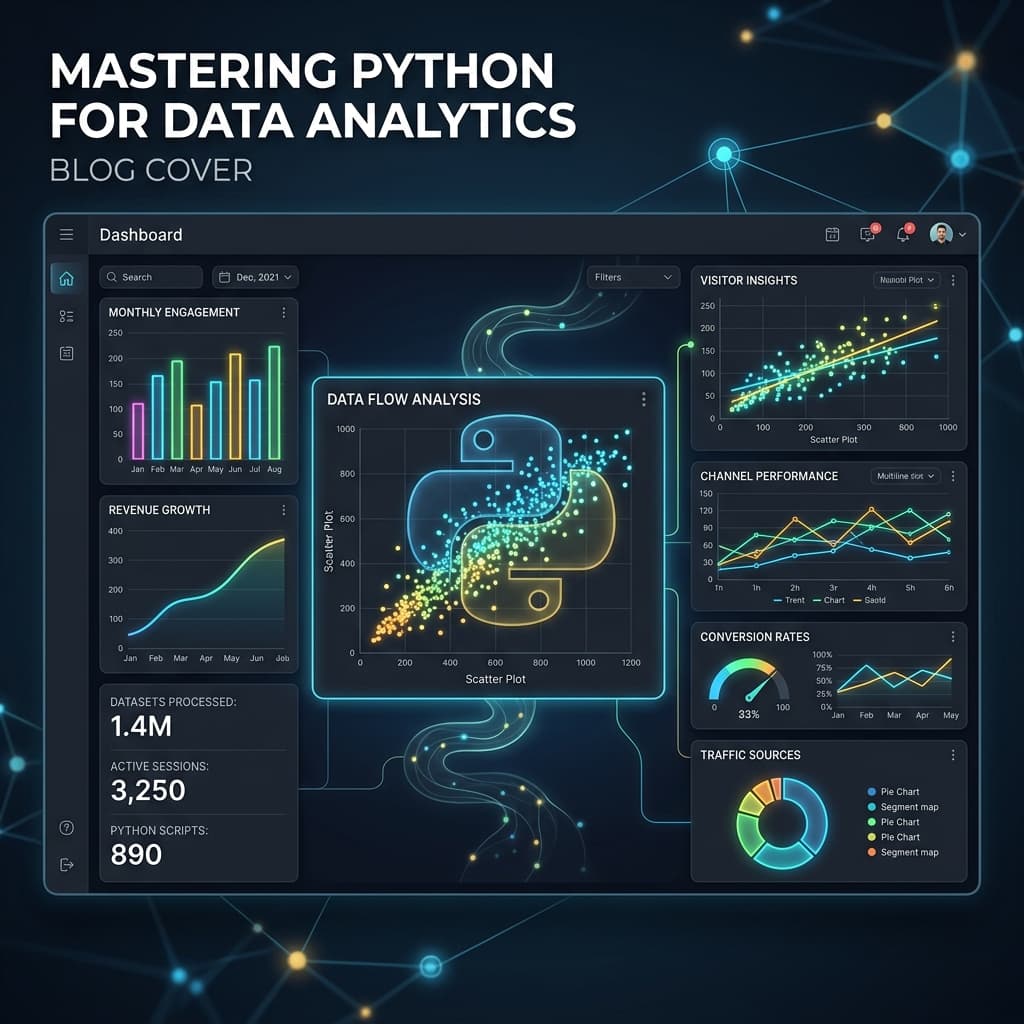
Data is the new oil, but unrefined data is useless. As a Data Analyst and Engineer, I've seen firsthand how raw, messy datasets can paralyze decision-making. Python, with its rich ecosystem of libraries, is the ultimate refinery for your data pipelines.
Whether you're dealing with a few thousand rows in Excel or massive datasets in a PostgreSQL database, Python provides the tools to extract, transform, and load (ETL) data efficiently.
The Power of Pandas
Pandas is the workhorse of data analytics in Python. It allows you to manipulate data with the ease of SQL but the flexibility of a full programming language.
From handling missing values to merging complex datasets, Pandas DataFrames make data wrangling intuitive. Mastering functions like groupby() and merge()is essential for any aspiring data professional.
Visualizing Insights
Numbers alone rarely tell a compelling story. Visualization is where data becomes actionable insight. While libraries like Matplotlib and Seaborn are great for exploratory analysis, connecting your Python pipelines to BI tools like Power BI or Apache Superset bridges the gap between technical analysis and business strategy.
Conclusion
Python is more than just a programming language; it's a comprehensive toolkit for turning raw data into business intelligence. By mastering its data analytics libraries, you can automate tedious tasks and uncover insights that drive real-world impact.